Although the presence of a peptidoglycan network in bacterial cell walls is well documented, the mechanical properties and architecture of the massive murein sacculus ( 3 x 10⁹ Da, a repeat of approximately 3.5 x 10⁶ moles of monomeric motifs in the Gram-negative E. coli as measured by Wientjes et al., 1991 are still poorly understood. Indeed, if it was clear from the early 60’s that this bag-shaped exoskeleton surrounding the plasma membrane was essential to maintain the cell shape and to sustain the osmotic pressure originating from the high concentration of solutes in the intracellular compartment, measurement of the elasticity and stiffness of the net had to await developments in Atomic Force Microscopy (AFM) at the end of the 90’s. In addition, peptidoglycan flexibility and heterogeneity prevented the determination of large-scale architectural features by conventional structural techniques, such as X-ray crystallography and NMR. Due to its limited resolution, negative-staining Transmission Electron Microscopy also failed to provide structural details of the peptidoglycan 3D superstructure, except maybe for the circumferential orientation of the glycan strands. The absence of key structural data did nevertheless not prevent scientists to build models, with the help of chemical data concerning the average glycan chain length and the percentage of peptide cross-links obtained by High-Performance Liquid Chromatography (HPLC) coupled to mass-spectrometry on enzymatically digested fragments. These models are described in the following paragraphs in the light of the experimental results obtained in the last five years from Electron Cryo-Tomography (ECT), Cryo-Electron Microscopy (Cryo-EM) and/or AFM.
Mechanical properties of the sacculus
The peptidoglycan layer is often seen as a rigid component of the bacterial cell wall, probably because of its functions as a key shape determinant and stress-bearing structure. Yet this appraisal is partial. Actually, sacculi have been shown by low-angle laser light scattering to be able to be stretched up to 3 times their initial surface area by adjustment of the pH and ionic strength condition of the sacculi samples Koch & Woeste, 1992. This conclusion corroborated previous in vivo observations showing that the murein layer undergoes an estimated 45% shrinkage when relaxed (Figure 5, left panel) by disruption of cytoplasmic membrane of E. coli filaments with a detergent Koch et al., 1987, and that the peptidoglycan is stretched under the effect of the osmotic pressure (Figure 5, middle panel).
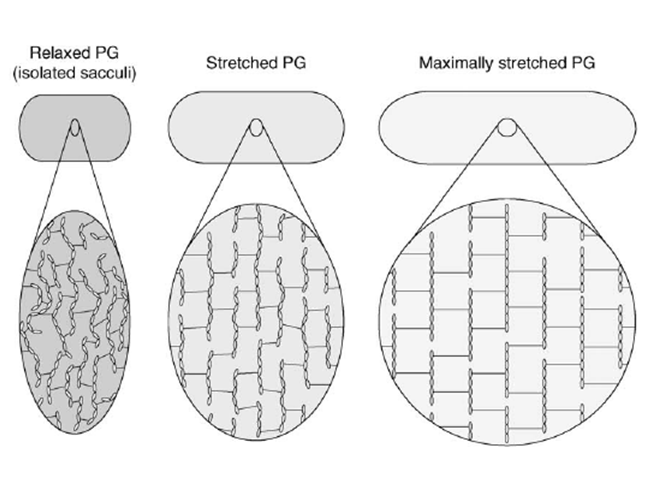
AFM is a good method to further probe and quantify peptidoglycan elasticity. AFM principle rests upon the sensing of a surface with a tip mounted on a cantilever, whose deflection can be measured by different methods using piezoelectric effects, optical interferometry or Laser Doppler vibrometry for example. This technique can be used either to acquire topological images of the bacterial surface and isolated sacculi or to measure adhesion forces between the tip and the sample to quantify the cell surface elasticity. With the latter method, Yao and co-workers Yao et al, 1999 measured a 25 MPa average Young’s modulus along the longitudinal axis of the E. coli hydrated sacculi, which is increased by a 1.8 factor along the perpendicular axis (Figure 5, right panel). The Young’s modulus translating the mechanical constraints necessary to extend a material by 100%, the anisotropy of this elasticity was suggested to result from the flexible peptides being rather parallel to the cell longitudinal axis, while the glycan chains would be predominantly perpendicular to it. When hydrated, sacculi were perfectly elastic, springing back to their original position after removal of the tip, but when dehydrated they proved to be more rigid. With these measurements, the authors estimated that an increase of the turgor pressure by one atmosphere would cause a 12% lengthening and 8% increase in diameter of the bacterium. Similar measurements were performed in the Gram-positive bacteriaium Staphylococcus aureus Loskill et al., 2014 and reported that the stiffness of the peptidoglycan increases with the percentage of cross-linking. As a result, the cell radius and cell wall stiffness are correlated to stress and pressure, thus offering a regulatory mechanism for cell shape changes under environmental conditions.
Mesoscale structural data on peptidoglycan
In addition to mechanical properties, microbiologists soon focused on other physical characteristics of the peptidoglycan layer, including its thickness, the size of pores within it, the average length of the glycan strands or the degree of cross-linking. In Gram-negative bacteria, most of this work was carried out on E. coli while most of the data were collected on B. subtilis and S. aureus in Gram-positive bacteria. When available, the latter will be complemented with recent data on the pathogenic ovococcus S. pneumoniae.
Thickness of the peptidoglycan layer
A range of values has been reported for the thickness of the E. coli peptidoglycan layer. An initial Small-Angle Neutron Scattering (SANS) study Labischinski et al., 1991 reported a 2.5-nm thick single-layered peptidoglycan covering 75 or 80% of the bacterial cell surface and a triple-layered region for the rest in exponentially growing W7 strains. Cryo-EM measurements on E. coli confirmed that peptidoglycan was mostly arranged in a layer roughly parallel to the membrane Gan et al., 2008, with a thickness of approximately 6.35 ± 0.53 nm Matias et al., 2003. Initial AFM studies Yao et al., 1999> provided a typical thickness of 3 nm and 6 nm for air-dried and hydrated E. coli sacculi, respectively, suggesting that discrepancies between the different measurements may come from the stage of the bacterial cell cycle and conditions used for the preparation of the sample in relation to the experimental technique used for the measurement. An alternative interpretation of the data relates to the number of peptidoglycan layers in E. coli, which could vary between 1 and 3 depending on the strain and growth conditions, as a value of 2.41 ± 0.54 nm Matias et al., 2003 was found for the Gram-negative Pseudomonas aeruginosa. This latter value is consistent with the most recent AFM measurement Turner et al., 2013 in E. coli from different bacterial strains and growth phases (2.0 ± 0.3 nm).
Studies in Gram-positive S. aureus and B. subtilis led to very different observations. As it could be expected for these Gram-positive bacteria, the peptidoglycan layer was shown to be much thicker than in E. coli, between 19 ± 4.3 nm and 33.6 ± 4 nm, depending on the species and the conditions, stretched in the cell or relaxed when isolated Matias & Beveridge, 2005, 2006. Interestingly, the same studies also evidenced the existence of a low-density region between the cytoplasmic membrane and the peptidoglycan, which was interpreted as a periplasmic-like space. Most recent AFM studies suggest that in ovococci like S. pneumoniae Wheeler et al., 2011 or Group B Streptococci Dover et al., 2015, the layer containing the low- and high-density peptidoglycan is only 7-to-9 nm thick with a thickness for the isolated peptidoglycan of 4.3 ± 0.8 nm for the former species.
Size of pores in the peptidoglycan layer
Sacculi pore size can be indirectly measured by determining the largest objects that can pass through it. It was studied in the two rod-shaped bacteria E. coli and B. subtilis, using fluorescein-labeled dextran molecules with a wide range of molecular weights Demchick & Koch, 1996. In both cases, a similar hole radius was determined, 2.06 nm for the former and 2.12 nm for the latter. From this evaluation in non stress-bearing conditions, it was supposed that a peptidoglycan layer in a relaxed-state should act as a molecular sieve, whith pores large enough for the passage of globular and uncharged proteins reaching up to 22 and 24 kDa respectively. It was further hypothesized that when stretched, globular macromolecules up to 50 kDa should be able to cross the murein network Vollmer, Blanot et al., 2008. Another study Vázquez-laslop et al., 2001 showed that proteins up to 100 kDa in size could go through the peptidoglycan of osmotically shocked E. coli cells, suggesting that the pore size in stretched peptidoglycan could even go up to 3.1 nm Vollmer & Höltje, 2004. Larger pores with a 13 ± 5 nm diameter were recently detected by AFM near the poles of the Gram-negative P. aeruginosa bacterium, that could accommodate pili or secretion systems Turner et al., 2013. Pore size could not be measured in Gram-positive bacteria due to the limited resolution of current EM and AFM techniques and the thickness of the peptidoglycan layer.
Average glycan-chain length
High-Performance Liquid Chromatography techniques, eventually coupled to mass spectrometry, afforded key structural data on the glycan chains average length Boneca et al., 2000. In these studies, peptidoglycan is labeled with N-acetyl[1-3H]glucosamine, purified and digested with the S. aureus Atl amidase which cuts the glycan-peptide bonds. The glycan strands are then isolated by chromatography (cation-exchange or gel-filtration chromatography depending on the acetylation of the glucosamine residues). A size-exclusion chromatography is finally used to separate and quantify the different glycan strands according to their molecular weight using a radioactivity monitoring, thus yielding to the distribution of the different chain lengths. Alternatively, the length of glycan strands can be determined through the quantification of the ratio of terminal 1,6-anhydro-N-acetyl-muramic acid with respect to its non-anhydro equivalent Glauner et al., 1988. In the Gram-negative E. coli, average glycan chain length depends on strain, growth condition and the stage of the cell cycle Vollmer & Seligman, 2010. Approximately 70 to 75% of the glycan strands contain less than 30 disaccharide units with an average of 8.9 units per strand Harz et al., 1990. The rest contains strands with up to 80 units. These features are quite representative of Gram-negative bacteria. In contrast, a large variability of the glycan strand length occurs in Gram-positive bacteria. The presence of surprisingly long glycan chains was revealed by HPLC in B. subtilis, with more than 500 disaccharide units Hayhurst et al., 2008 for more than 25% of the strands, some of which were even estimated by AFM to measure up to 5 μm, corresponding to approximately 5000 units. Similarly, 44 to 57% of the glycan strands in the ovococcus S. pneumoniae contain more than 50 disacccharide units Wheeler et al., 2011, while in S. aureus they have an average of 6-disaccharide units Boneca et al., 2000.
Degree of cross-linking
Even more than the glycan chain length, the degree of cross-linking highly depends on the bacterial strain, the growth phase and environmental conditions. In E. coli, it can easily vary between 31 and 61% Vollmer & Seligman, 2010. B. subtilis also shows different percentages of 56%, 63%, and 3% Atrih et al., 1996, 1999 in bacilli from exponentially growing, stationary, or sporulation phases, respectively. The percentage of cross-linking is in the high values of 74-92% in S. aureus Vollmer & Seligman, 2010, while it is only 35% in S. pneumoniae Bui et al., 2012. This parameter may nevertheless not be highly determinant in the overall peptidoglycan architecture, and is generally not considered in the design of organizational models. To determine these values, purified sacculi are treated with muramidases, such as mutanolysin, or lysozyme, which break the glycan strands between the disaccharide motifs. The obtained muropeptides are then separated by HPLC on a hydrophobic matrix, to be further analyzed and identified by Matrix Assisted Laser Desorption/Ionization – Time Of Flight Mass Spectrometry (MALDI-TOF MS; Desmarais et al., 2013). This approach establishes the ratio of each of the monomers (disaccharide bearing tri-, tetra-, or penta-peptides), dimers, trimers and eventually more reticulated material, from which the abundance of cross-linked and un-crosslinked disaccharide peptides can be determined.
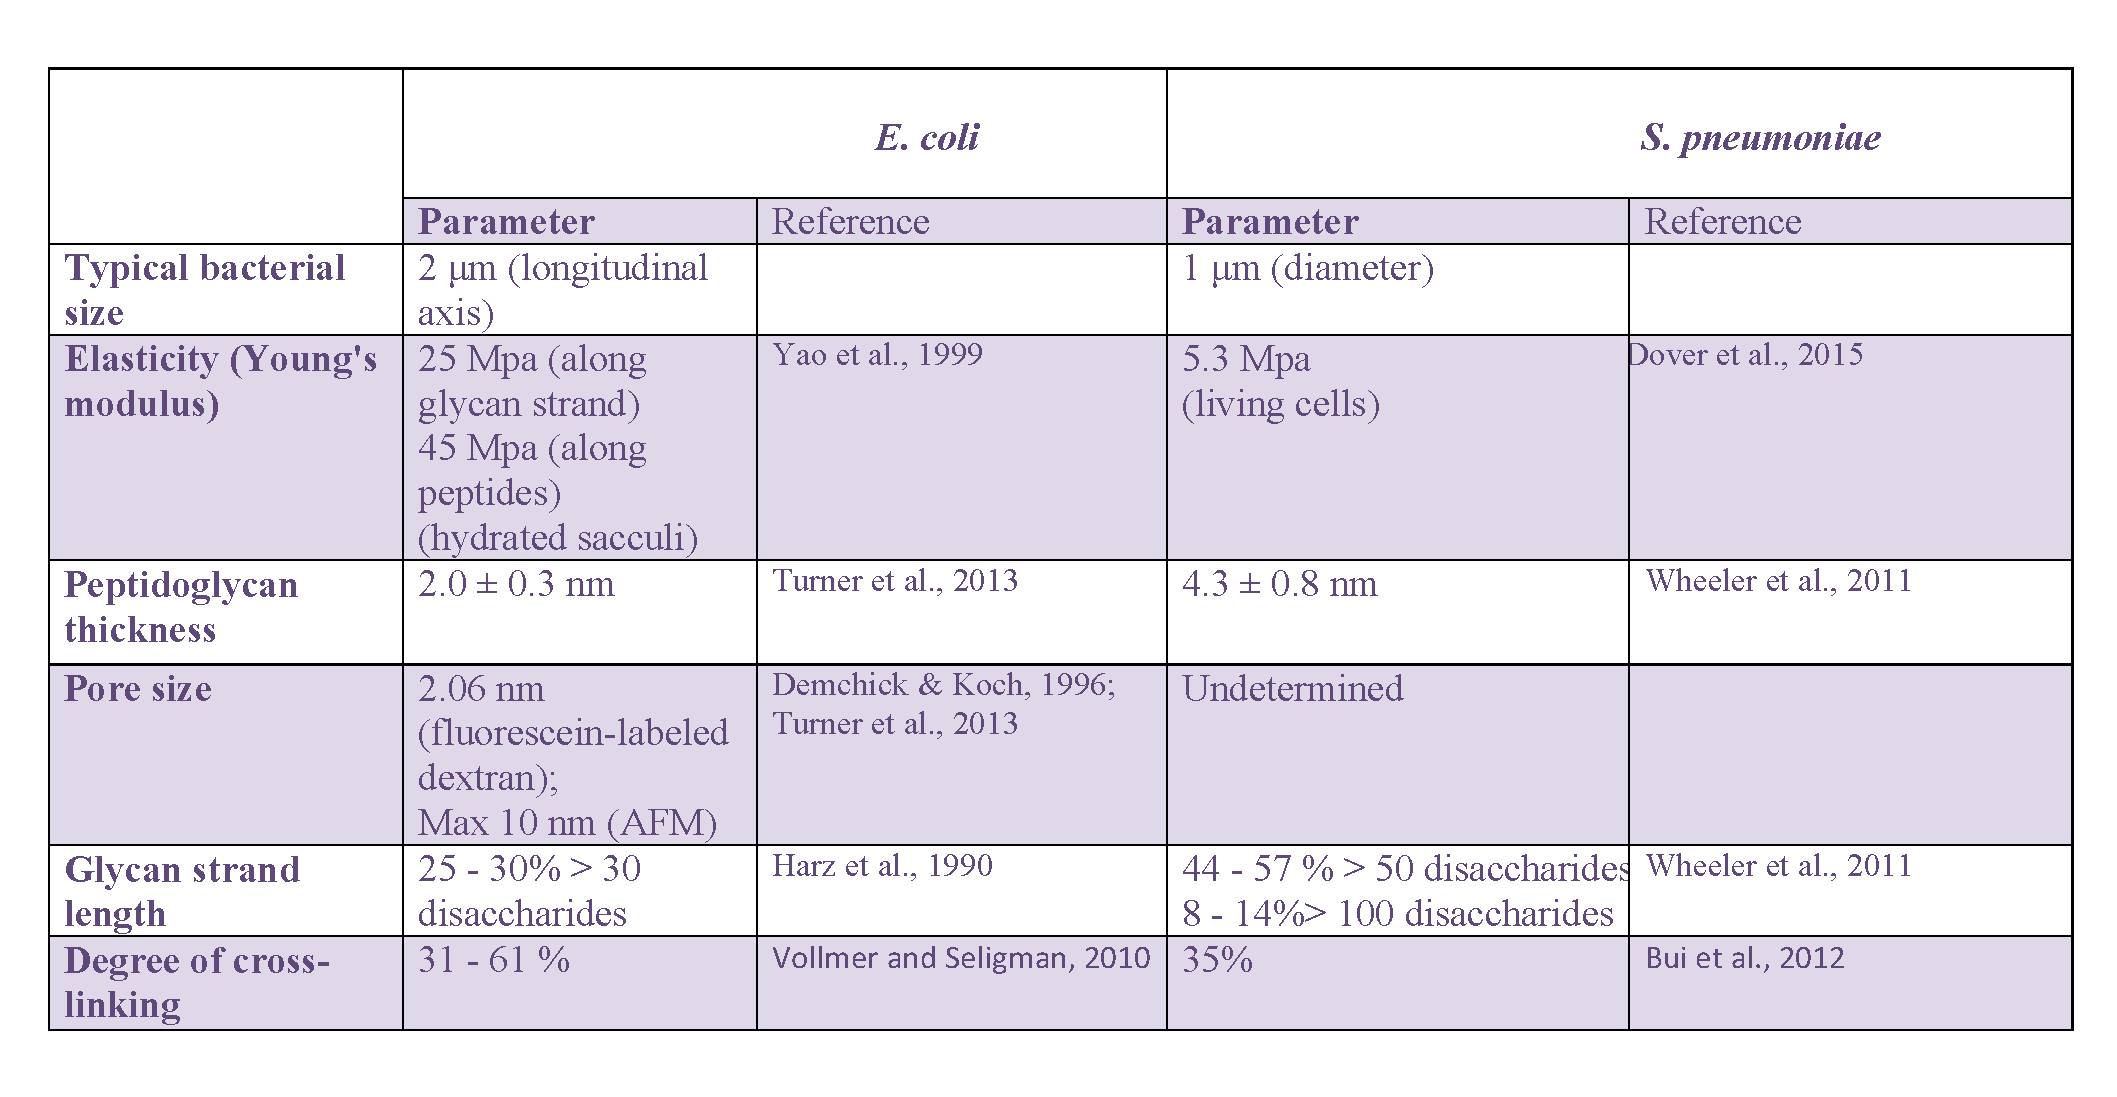
A summary of the values for main architectural peptidoglycan parameters discussed in this section regarding E. coli and S. pneumoniae can be found in Table 1.
Models for peptidoglycan organization
Determination of key physical parameters of sacculi enabled the emergence of hypotheses concerning the structural organization of peptidoglycan. Two main models were proposed, the layered and the scaffold models, which are presented in Figures 6 A and B, respectively
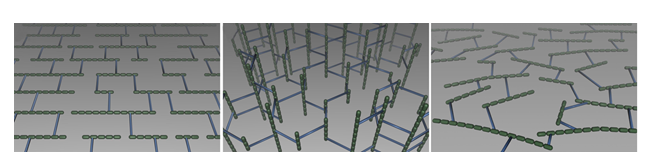
In the layered model (Figure 6 A), which is currently the most accepted model in the scientific community, glycan strands would be positioned parallel to the cytoplasmic membrane. Because it is generally accepted that glycan chains should rather have a right-handed helical conformation, with a pitch of 3 or 4 disaccharides per turn (Gumbart et al., 2014 – Meroueh et al., 2006, it is thought that peptide stems would be pointing in 3-to-4 alternating different directions. It is therefore suggested that half of them would be in the glycan chain plane, while the other ones would be orthogonal, and available for cross-linking with neighboring peptidoglycan layers. Such an organization could yield to the multi-layered organization in Gram-positive bacteria and could explain the thickness variability observed in some cases in E. coli. To explain swelling of the peptidoglycan with the osmotic pressure, it has been put forward that glycans could rather adopt zigzaging conformations, whose cross-linking could give rise to hexagonal pores called tesserae (Figure 7 A).
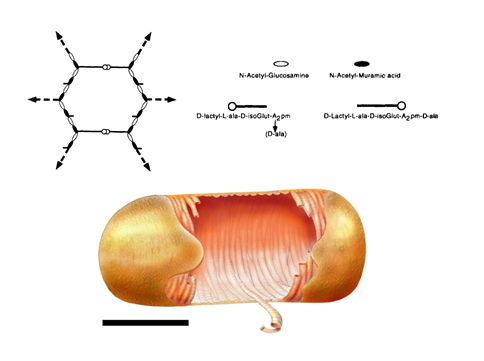
The existence of such structures was nevertheless not observed in recent AFM and CET studies Turner et al., 2013. In B. subtilis, a model, which could be associated with a different kind of layered-peptidoglycan organization, proposes that glycan strands could stack circumferentially along the transversal axis of elongated bacilli (Figure 7 B) to form 50-nm wide cables, as imaged from recent AFM studies in B. subtilis Hayhurst et al., 2008. The overall organization in the model would be also maintained by the peptide cross-links, oriented along the cell longitudinal axis. Such a model could thus accommodate the current experimental data on elasticity, peptidoglycan thickness, and glycan chain length Turner et al., 2014.
As for the scaffold model (Figure 6 B), it proposes that the glycan strands are perpendicular to the cell envelope, with each of them being cross-linked to the others through their peptide stems Dmitriev et al., 2004 Meroueh et al., 2006. If this model was rapidly discarded for E. coli on the comparison of the average peptidoglycan thickness and glycan strand length, it persisted in Gram-positive bacteria, such as S. aureus Dmitriev et al., 2004. In this context, the further the chains, the older there would be as they are expected to be inserted from close to the cytoplasmic membrane. However, to date, this model has only been supported by computer simulations but was not confirmed experimentally.
Organization of the glycan strands is most probably nevertheless not as regular as anticipated from the two initial models as suggested in Figure 6 C. Indeed, if recent ECT ( Gan et al., 2008 and AFM ( Turner et al., 2013) data on E. coli suggest that tubes of density are mostly in the plane of the sacculus and roughly perpendicular to the cell longitudinal axis, they show heterogeneity. In this respect, the computational model proposed by Gumbart and coworkers Gumbart et al., 2014, with 12 glycan strands of 17-to-26 disaccharides is in agreement with experimental data on elasticity, thickness and pore radius. Most recent AFM data Dover et al., 2015 on Group B Streptococcus suggest that this situation may not be unique to the peptidoglycan of Gram-negative bacteria, as a net-like structure of bands with a 25-nm width was imaged in these bacteria. The situation in Gram-positive S. aureus, a challenging organism with respect to its peptidoglycan architecture, as this spherical bacterium is dividing sequentially following three different orthogonal plans, is somewhat in between the regular B. subtilis structure and the less symmetrical E. coli organization. In this organism, it was shown by AFM that equatorial perpendicular peptidoglycan structures encircle the cell, positioned at the previous and new division sites Turner et al., 2010. Regions of concentric rings and knobbly architectures were also described on sacculi, the former being supposed to be nascent peptidoglycan while the latter are thought to be older matured material Turner et al., 2010. A comparison of the current peptidoglycan architecture in different species can also be found in Turner et al., 2014.
From these results on a few different bacterial species, it appears that peptidoglycan may adopt a broad diversity of arrangements. However, due to the little quantity of available studies and species investigated, the models trying to describe these observations are to be cautiously considered and await technological developments in high-resolution imaging technology from AFM or optical trapping. While these huge biological macromolecule structures are still puzzling, their atomic chemical composition is much more documented.